I. Overview
Prometheus for monitoring.
II. Concept
1. Concept
Prometheus is an open-source (OSS) systems monitoring and alerting originally built at SoundCloud and has been joined CNCF in 2016 as the second hosted project.
a. Data Model
Prometheus fundamentally stores all data as time series, which is a streams of timestamped values belonging to the same metric and the same set of labeled dimensions.
Prometheus may also generate temporary derived time series as the result of queries.
Metric names and labels Every time series is uniquely identified by its metrics name and optional key-value pairs called labels.
Metric names
- Metric names should specify the general feature of a system that is mesured
- Metric names may use any utf-8 characters
Metric labels
- Label let us capture different instances of the same metric name
Notation
<metric name>{<label name>="<label value>", ...}
b. Metric Types
The prometheus client libraries offer 4 core metrics types:
- Counter
- Gauge
- Histogram
- Summary
Counter A counter is a metrics that represents a single increasing counter whose value can only increase or be reset to zero on restart (E.g. requests served, tasks completed …)
Do not use counter to expose a value that can decrease. (E.g. Currently running processes) Instead use a gauge.
Gauge A gauge is a metric that represents a single numerical value that can arbitrarily go up and down.
Gauges are typically used for measured values like temperatures or current memory usage, number of concurrent request.
c. Jobs and Instances
An instance is an endpoint which you can scrape metrics. it is identified by its <host>:<port>
A jobs is a collection of instances with the same purpose, E.g. a group of identical webserver
For example:
scrape_configs:
  # This is the "Job"
  - job_name: 'api-servers'
    static_configs:
      - targets:
        - '192.168.1.10:8080'  # Instance 1
        - '192.168.1.11:8080'  # Instance 2
        - '192.168.1.12:8080'  # Instance 3
When prometheus scrapes a target, it attaches some labels automatically to the scraped time series which serve => to identify the scraped target:
- job: is the configured job name that the target belongs to.
- instance: the
<host>:<port>of the target URL that was scraped
2. Feature
- multi-dimensional data model with time series data
- PromQL to query that data model
- Target are discovered via service discovery or static configuration
3. Characteristics
- Pull based system over HTTP
- use push gateway for short-lived jobs
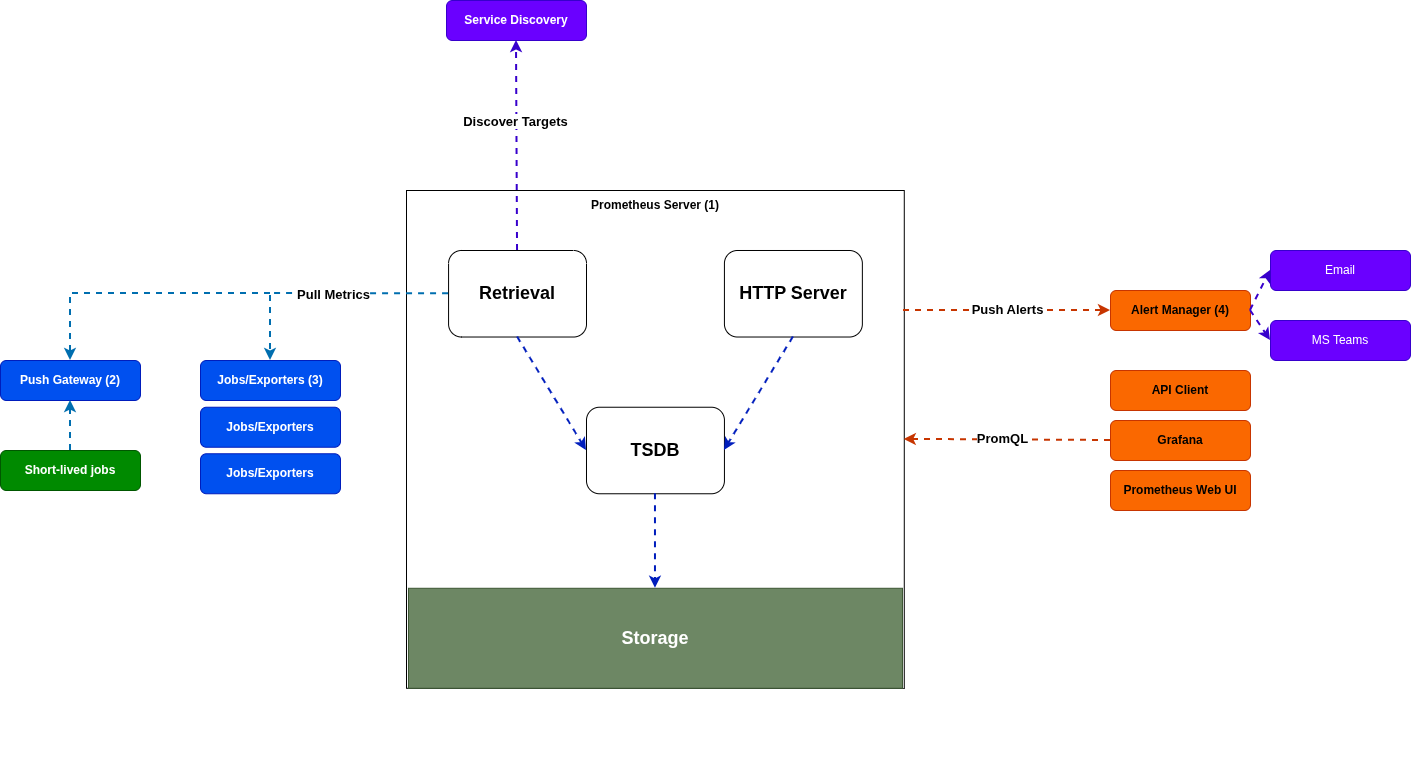
III. Architecture
1. Components & Architectture
- Prometheus Server (1) scrapes data via retrieval and stores into storage
- Client libraries for instrumenting application code
- A Push Gateway (2) for supporting short-lived jobs
- Special-purpose exporters (3) for special service
- Alert Manager (4) to handle alert
- And other support tools